ChargeLog
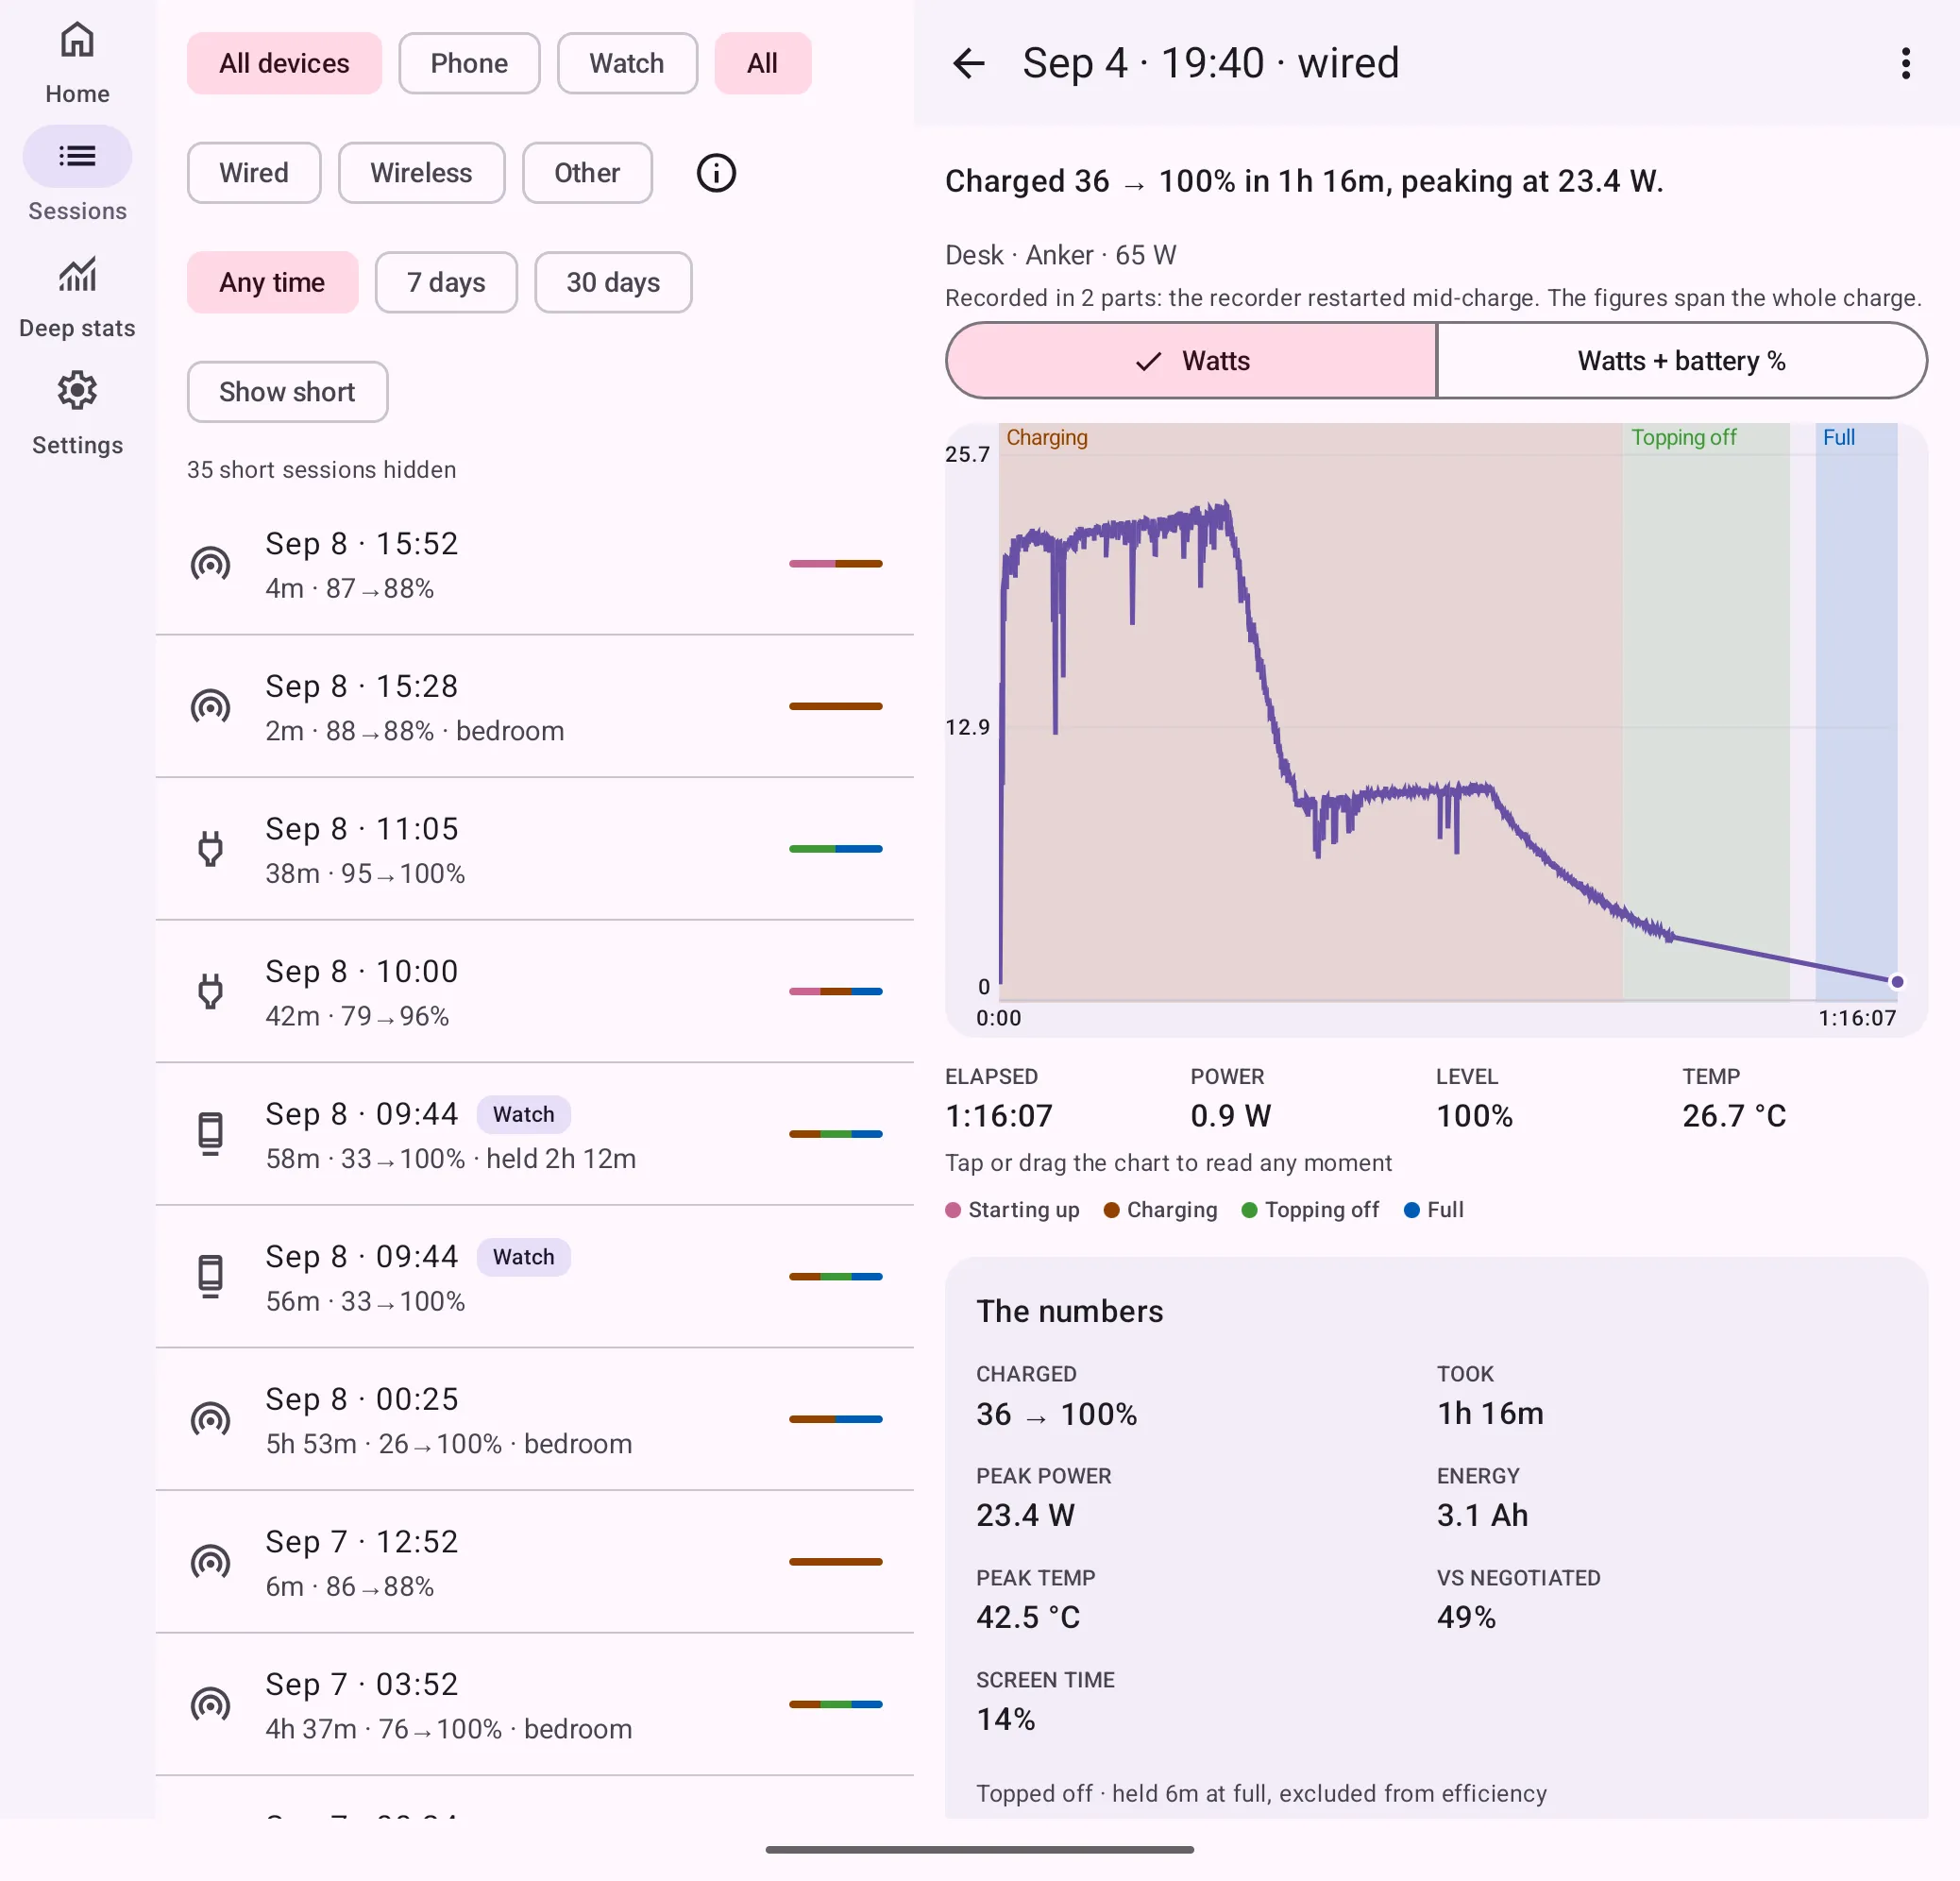
I wanted to see what a fast charge does from plug-in to unplug, beyond the percentage.
- Status
- In beta
- Made of
- Kotlin
- Outcome
- 1,272 charging sessions accepted into its dataset between 20 September and 1 October 2026.
- Led to
-
- astro-forge: website practices
- Links
What it records
A phone shows a percentage. ChargeLog turns each plug-in into a session: the power curve, the charging phases, the temperature, and the physical context. It is not a battery monitor: no drain rankings, no task killing, no optimization tips.
Two parts, one seam
The app is built in two parts. The recording engine is open source under GPL-3.0-only: an always-on foreground service that turns every plug-in into an NDJSON session log, about 2,500 lines of Kotlin, tested against fixtures from real devices. The analysis, every screen, and the app itself are proprietary.
The line between them is one interface. The app implements RecorderHost and the recorder calls
into it; the recorder never reaches into the app. It draws nothing of its own: the app supplies the
notification text, the labels, and the charge target. Every session log carries the app version
that wrote it, and the engine’s version moves with the app’s, so a log always names the code
behind it.
Where it is
It’s on Google Play for testers, with a Wear OS companion that records the watch too. Google asks for a dozen people to run a new app for two weeks before it can go public; that’s the stage it’s at.